Finding information in your knowledge graph
As more companies adopt graph technology to solve their business problems one aspect that comes up in conversation with almost everybody we talk to is the desire to easily search and understand the information in their graph.
There are a great variety of use cases for graph browsing experiences. For some it is more akin to being able to view a data catalogue (perhaps a list of taxonomies and ontologies for instance), whilst for others being able to walk around the graph in a free manner is important.
Most people will have a different view on what the user experience is. It may depend upon what users are browsing within the graph and need to adjust accordingly. For instance, taxonomies are generally tree-like structures, whilst catalogues are lists and other data may be connection rich, so a more connection based browse may be applicable.
The issue for many people is that they don’t want to, or don’t have the time or budget, to build that user experience. And, if a goal is to show value from a graph implementation quickly, then getting side-tracked on building visualisations can be a barrier to doing that.

Therefore, the next best option is often an out-of-the-box experience. However, it can be very difficult to provide a ‘generic’ experience that meets expectations - there are just too many possible features or behaviours for one application to do everything.
Another factor that we always ask people to consider is the scale that any solution needs to work at. It is very different if it is just a handful of users as opposed to potentially tens of thousands of corporate users. If the solution needs to be internet-facing with anonymous access (i.e. open to everybody) the scale issue becomes more important still and the cost of servicing that scale also needs to be considered.
Many solutions for discovery combine a variety of sources of information - taxonomies, ontologies and data about things an organisation produces or handles, such as products. All of this data can potentially be stored in an organisation’s graph.

So what can be done to help companies find information easily?
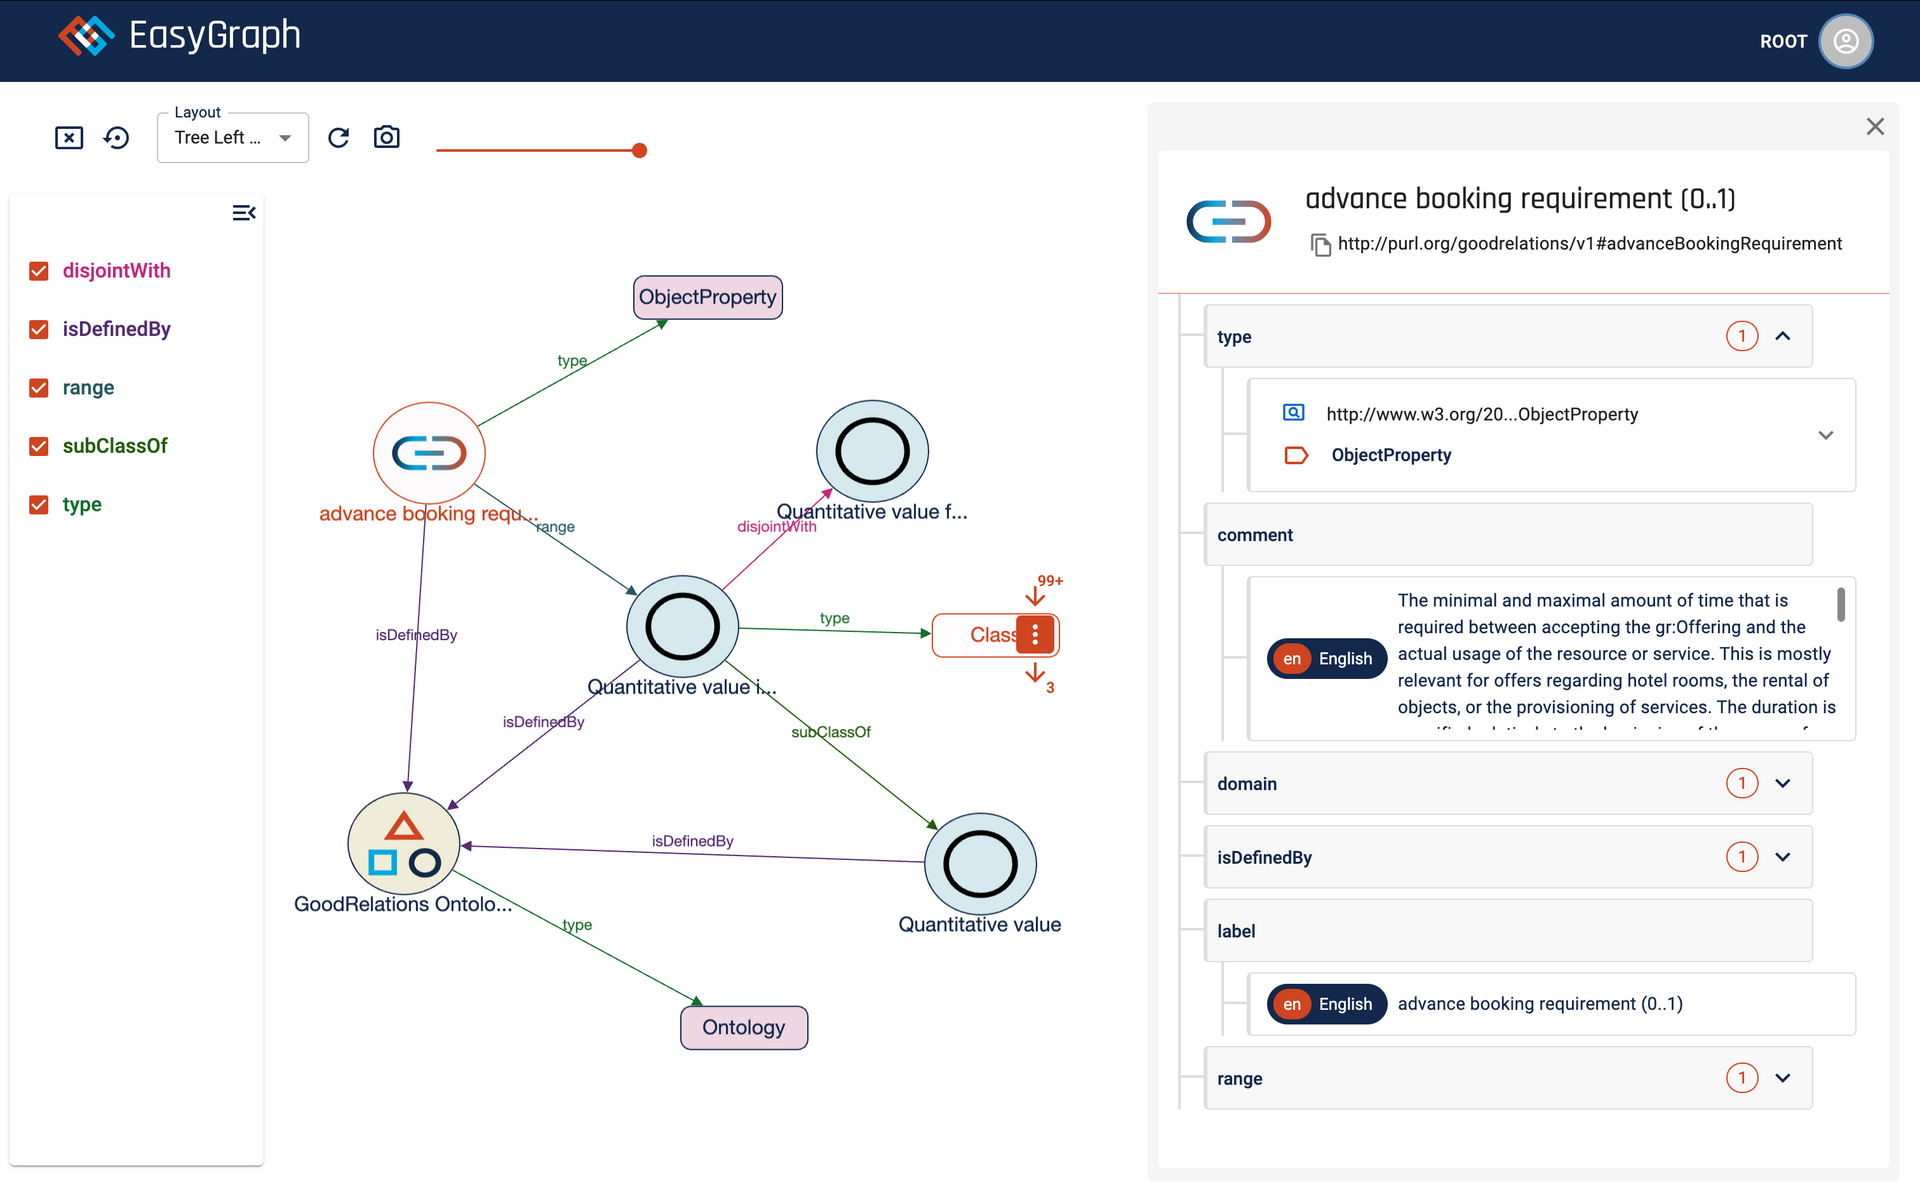
To tackle the issue above we provide EasyGraph Explorer. Explorer comes as part of our EasyGraph platform and provides a no-code, configurable, user experience that organisations can use to allow users to discover and navigate their graph data.
EasyGraph can scale to meet different workloads and can be easily integrated with existing systems. Taxonomies and ontologies can be managed in Graphologi, for instance, and easily sent to EasyGraph, whilst other systems can load data into EasyGraph via APIs.
EasyGraph Explorer gives companies lots of options to customise the user experience, from theming and customising images, through language set up to the filters available for searching.
So, if you want to give your users a great way to find information in your graph without spending a lot of time and money on development it can be done. Give EasyGraph Explorer a go!


