Blog
Articles and information about
Graphifi and our applications

Understanding and navigating healthcare information can be daunting, even for healthcare professionals. Patients and professionals involved in the medical and healing professions need to reference specialists, facilities, institutions, quickly and efficiently in order to provide or obtain the needed care immediately. Clinia is a Montreal based health information provider that manages health directories for medical apps that are used by clinicians, doctors, healthcare providers and institutions.
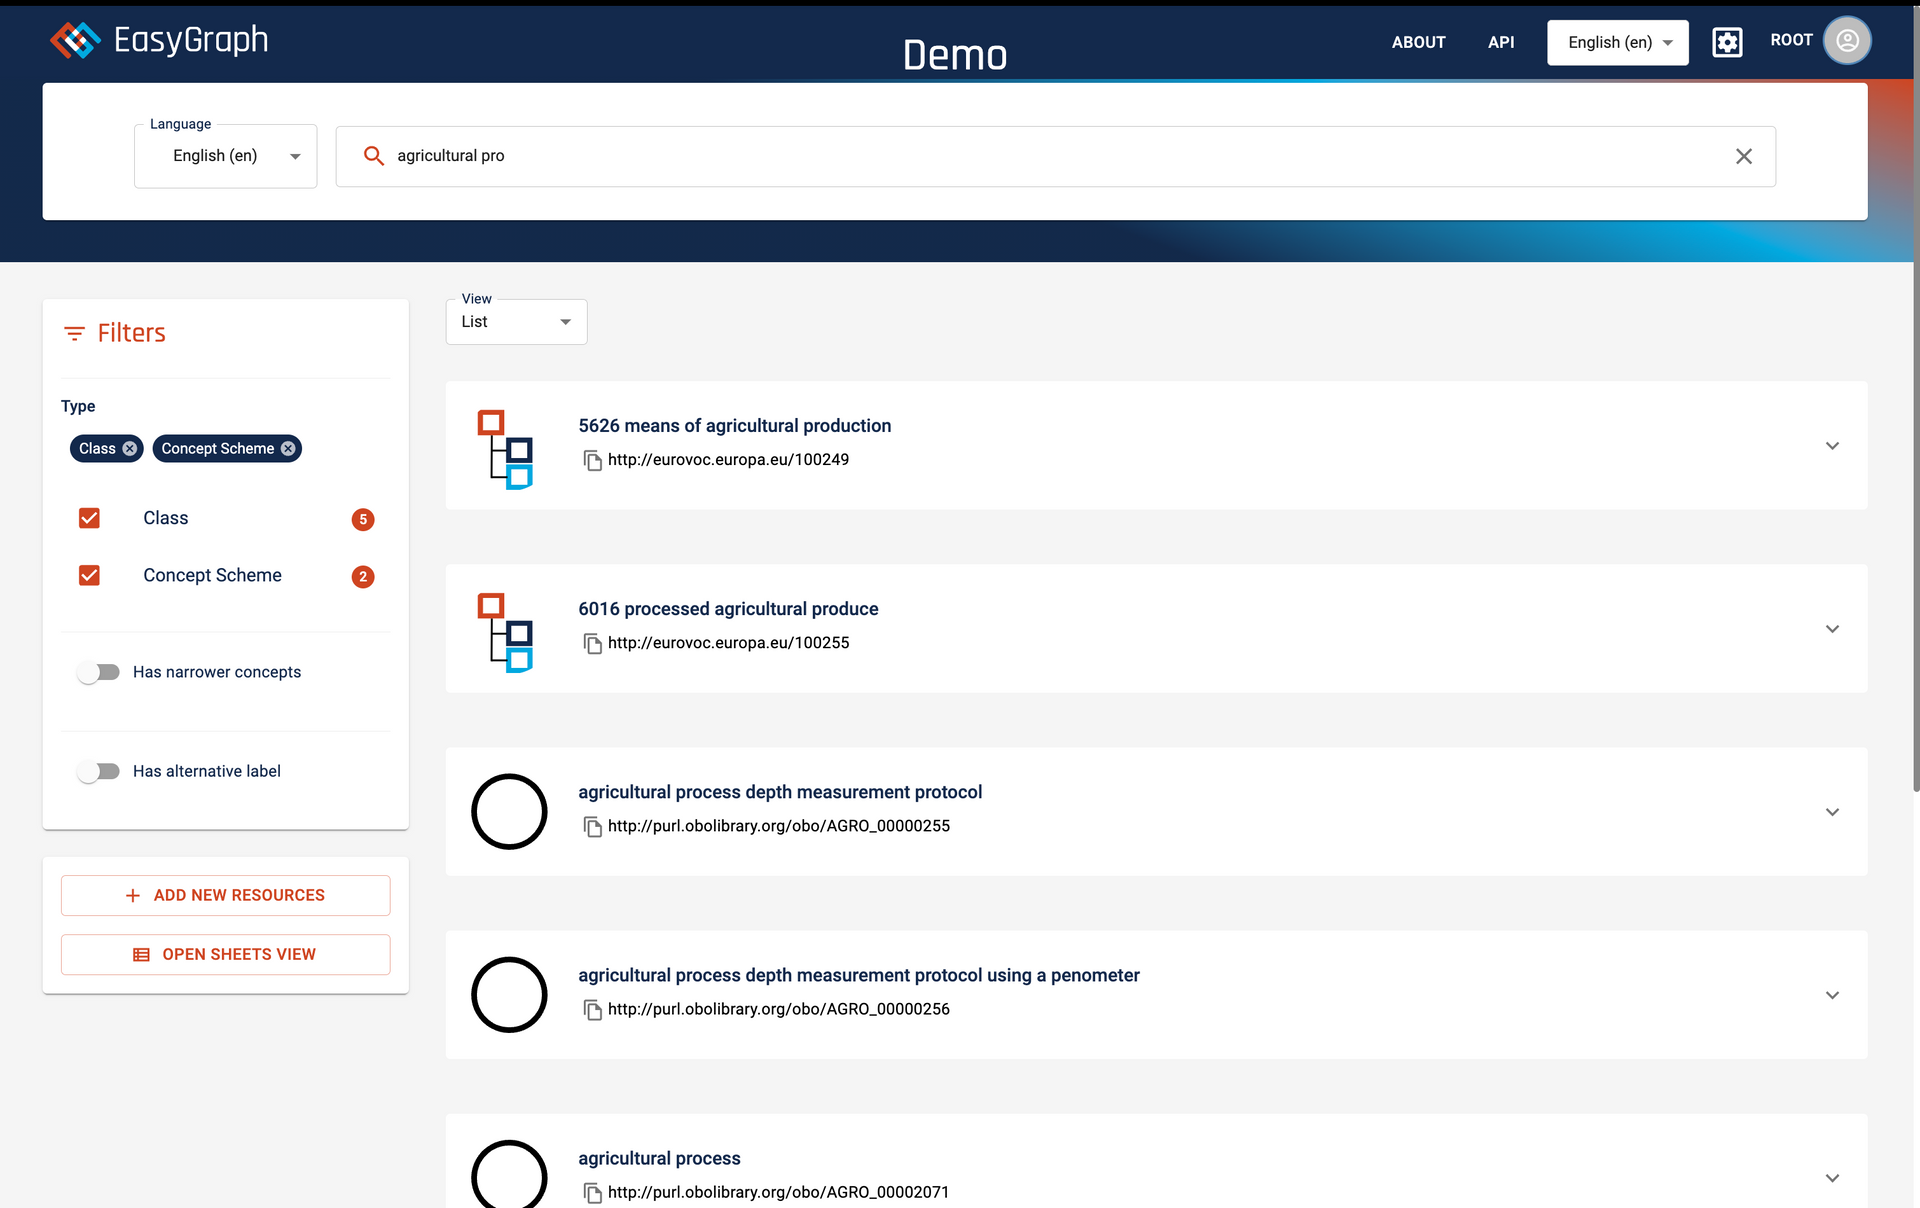
As more companies adopt graph technology to solve their business problems one aspect that comes up in conversation with almost everybody we talk to is the desire to easily search and understand the information in their graph. There are a great variety of use cases for graph browsing experiences. For some it is more akin to being able to view a data catalogue (perhaps a list of taxonomies and ontologies for instance), whilst for others being able to walk around the graph in a free manner is important. Most people will have a different view on what the user experience is. It may depend upon what users are browsing within the graph and need to adjust accordingly. For instance, taxonomies are generally tree-like structures, whilst catalogues are lists and other data may be connection rich, so a more connection based browse may be applicable. The issue for many people is that they don’t want to, or don’t have the time or budget, to build that user experience. And, if a goal is to show value from a graph implementation quickly, then getting side-tracked on building visualisations can be a barrier to doing that.
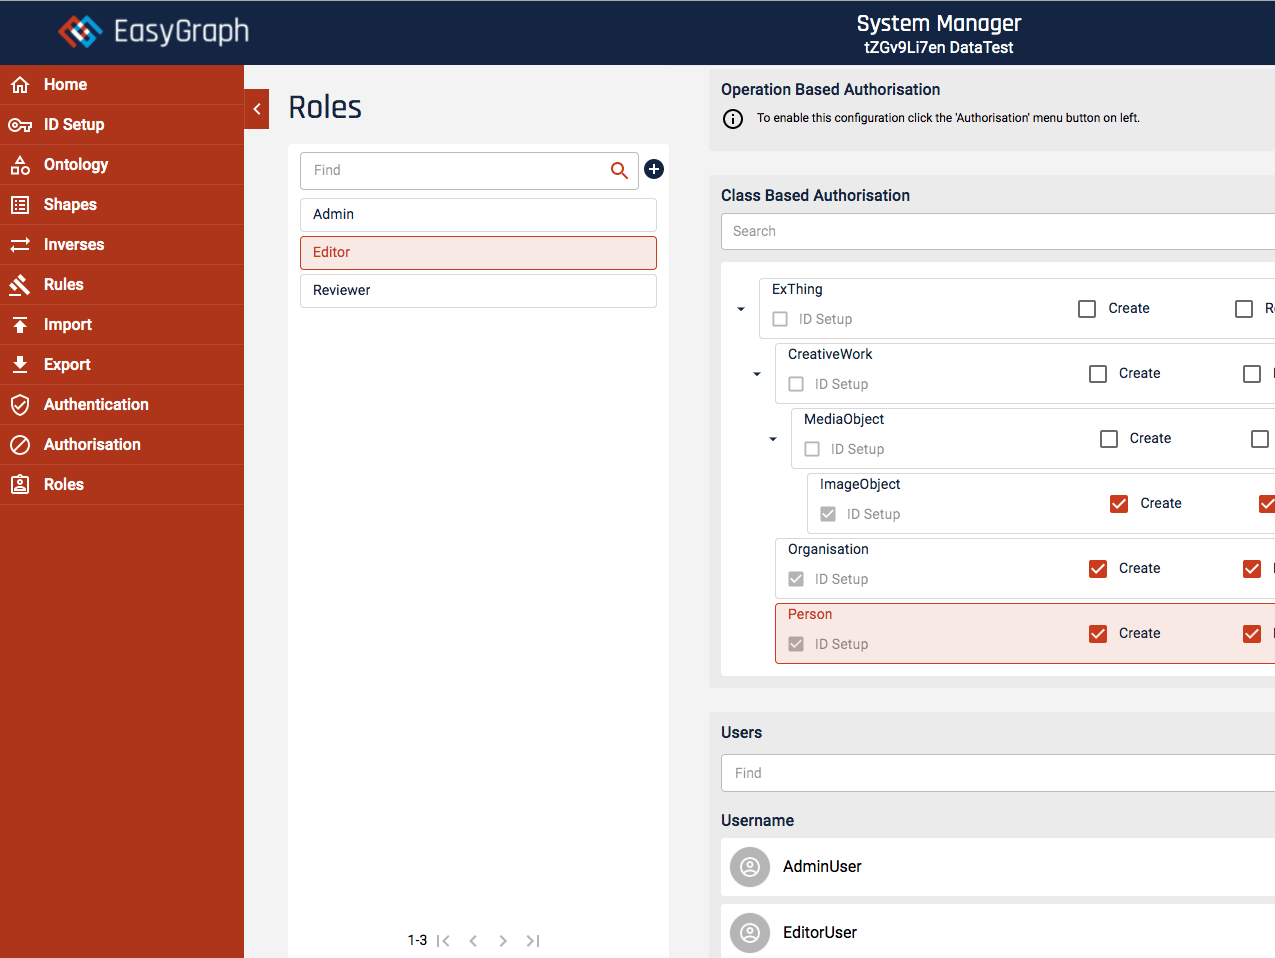
Over the last few months we have been working hard to get some cool new features implemented in EasyGraph and we are pleased to announce the release of EasyGraph version 1.0.1, which is a major update in terms of features, including: JWT based authentication and user management Role based access control Multiple datasets in a single EasyGraph instance System Manager UI improvements and monitoring Support for AWS Neptune as a backend AWS CloudFormation templates for use in an EasyGraph trial AWS CloudFormation templates to set up an AWS API Gateway We have also made numerous UI improvements and fixed a number of bugs.

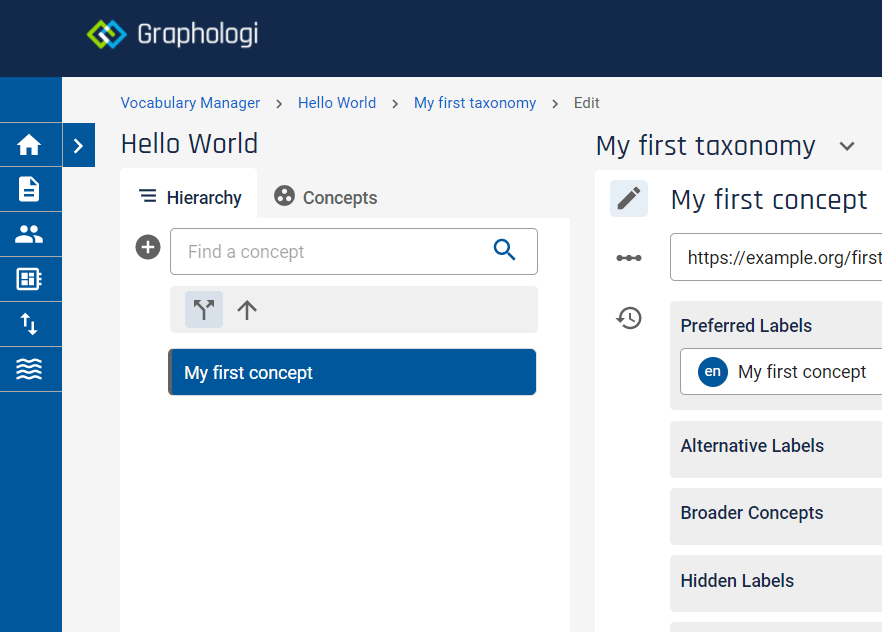
We continue to take on board feedback from users and the Graphologi 1.0.11 release includes three major enhancements driven by that feedback. This release includes: Customisable TSV (tab-separated values) export for taxonomies. TSV is a spreadsheet-like format easily imported into applications such as Excel or Google Sheets. Advanced search across a project. Improved history viewing and the ability to download history. As well as that we have made various minor improvements to the user experience as well as having fixed a number of bugs. From this release forward a set of release notes will be available for each release at https://graphologi.com/release
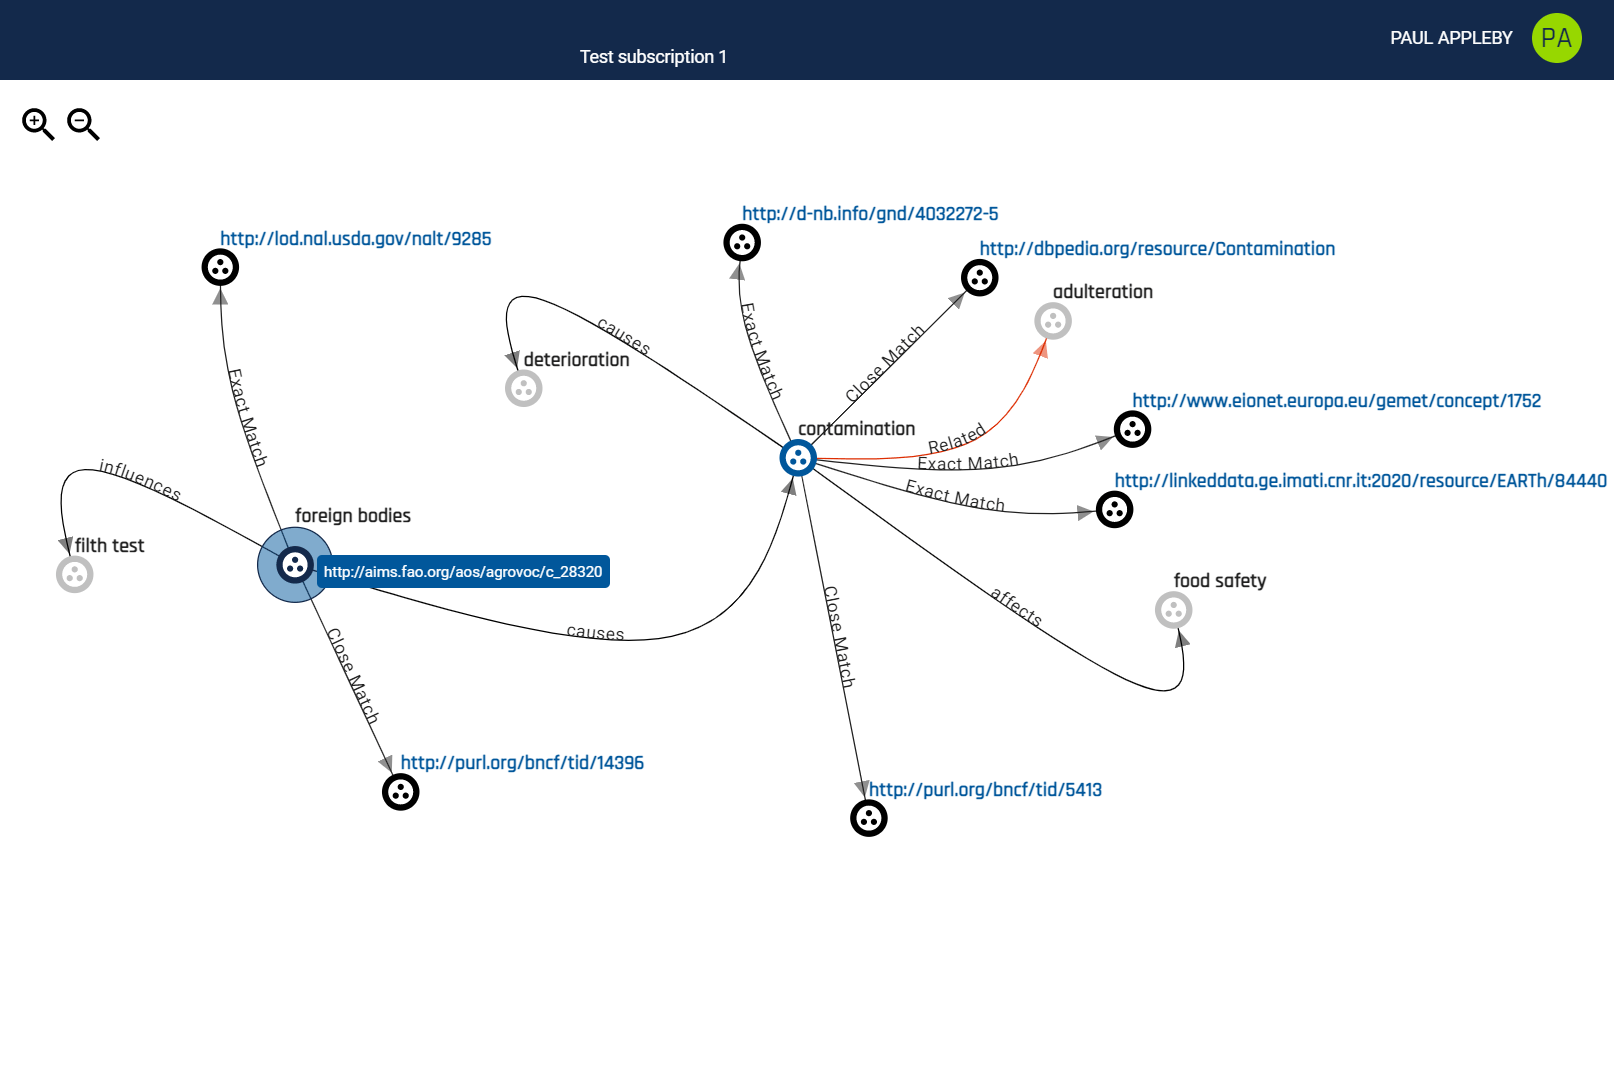
One of the questions we have received most frequently in discussions is 'can you visualise the concepts?'. With the 1.0.9 release of Graphologi we can now answer that question with a 'yes'. Visualisation in Graphologi lets you navigate around your graph of data starting from a concept. You can select which properties you wish to include and can expand the graph by including additional connected concepts. An example is given below using the UNESCO thesaurus. This thesaurus has a large amount of 'related' connections (using the SKOS related property). The starting concept for this example is 'Agricultural economics' and you can see from the connections in the image how it relates to other concepts within UNESCO.

It is only a couple of months since we went live with Graphologi but we haven't been slowing up. Release 1.0.7 is now available. This is the first major update in terms of features, including: Improved export and import. Support for N-triples on import into a project. Deprecation of concepts. Make suggestions for new concepts or changes to existing concepts. As well as that we have made numerous minor improvements to the user experience and fixed a number of bugs.
Graphifi are very happy to announce the beta release of our EasyGraph platform. Our mission is to make using knowledge graphs as easy as possible and therefore we have added a Schema Builder application - a visual way to create a schema. Schema Builder completes the set of applications that will make up the first production release of EasyGraph.

As it is just over a month since we released the Graphologi beta we thought it would be a good time to give you a quick update on how things are progressing. Our focus has mostly been on testing, which is going well, but based on the feedback we have received and our own experiences we have also added some new enhancements.


